Comparisons in Quantum Sensor Output for Different Light Sources
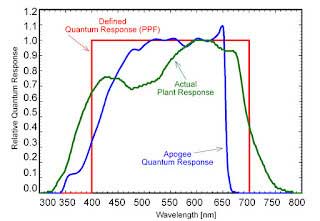
Since 1972 when a scientist named Keith McCree demonstrated that counting photons in the photosynthetically active range (400 to 700 nm) would better predict photosynthesis than the measurement of foot-candles, the quantum sensor has been used to measure radiation for plants. This is called the photosynthetic photon flux density (PPFD). The following graph shows McCree’s findings for the actual plant response (green) along with the defined quantum response (red) and Apogee’s quantum sensor response (SQ/MQ-100, SQ/MQ-200, SQ/MQ-300, and SQ-400 Series) (blue).

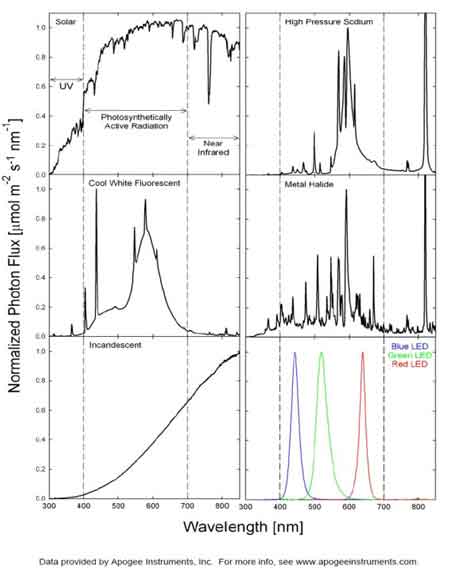
Notice that the defined quantum response appears as a perfectly flat spectral response, meaning it weights all wavelengths of light exactly the same between 400 and 700 nm. Apogee offers quantum sensors (SQ/MQ-100, SQ/MQ-200, SQ/MQ-300, SQ-400) that are calibrated for either sunlight or electric light. The reason for this is due to the significant differences in spectral output among light sources. The following graphs illustrate those differences.

For spectral outputs of popular light sources, spectral errors for Apogee's sensors to those light sources, and the correction factors for those sources, view Spectral Errors for Popular Light Sources and How to Correct Them
