5 Sources of Error that affect Quantum Sensor Measurements
In this article
This article introduces the different types of errors that can affect quantum sensor measurments.
What is a Quantum Sensor/Meter?
Quantum sensors measure photosynthetically active radiation (PAR)-light from 400 to 700 nm that drives photosynthesis. Apogee quantum sensors measure the photons of PAR that land on a surface in the units of µmol m-2 s-1.
Standard quantum sensors consist of a combination of a photodetector, optical filter, and diffuser mounted in a housing. Apogee quantum sensors consist of a silicon-cell photodiode to measure the photons of light and optical filters placed over the detector to restrict the wavelength range of photons that can hit the detector. Apogee quantum meters consist of the same quantum sensor attached via cable or integrated into a handheld meter with a digital display.
Quantum sensors are designed to match the ideal quantum response-equal response to photons at each wavelength between 400 and 700 nm- as close as possible. However, matching this response is challenging in practice and no quantum sensor exactly reproduces the response, therefore, each quantum sensor has its own spectral response.
This article will focus on the errors that can occur when using quantum sensors to measure PAR and how to correct for those errors. For information on PAR, PPF, PPFD, DLI, and the difference between measuring light for plants and humans, read our article Photosynthetically Active Radiation (PAR) Explained-Light for Plants.
Sources of Error for Quantum/PAR Sensors
Understanding the potential sources of error in you PAR measurements is important for making accurate measurements and optimizing your growth environment lighting. Major sources of error include: calibration uncertainty, directional (cosine) error, level error, temperature, and spectral error.
The purpose of sensor calibration is to reduce the measurement error by correcting the signal to match a reference value that is assumed to be the true and correct value. During the calibration process the minimum amount of transfer steps possible should be used to minimize the uncertainty. Typically referece measurements are made with the best equipment available by an accredited institution, such as the National Institute of Standards and Technology (NIST).
Apogee Instruments Original Quantum Sensor (100 - 400 Series) Calibration Uncertainty
Apogee original quantum sensors are calibrated through side-by-side comparison to the mean of four Apogee model SQ-110 or SQ-120 transfer standard quantum sensors under high output T5 cool white flourescent lamps. The transfer standard quantum sensors are calibrted through side-by-side comparison to the mean of at least three LI-COR model LI-190R reference quantum sensors under high output T5 cool white fourescent lamps. The reference qauntum sensors are recalibrted on a biannual schedule with LI-COR model 1800-02 Optical Radiation Calibrator using 200 W quartz halogen lamp. The 1800-02 and quartz halogen lamp are traceable to the NIST.
Apogee Instruments Full-Spectrum Quantum Sensor (500 Series) Calibration Uncertainty
Apogee full-spectrum quantum sensors are calibrated through side-by-side comparison to the mean of four Apogee model SQ-500 transfer standard quantum sensors under T5 cool white flourescent lamps. The transfer standard quantum sensors are calibrated through side-by-side comparison to the mean of at least three LI-COR model LI-190R reference quantum sensors under high output T5 cool white flourescent lamps. The reference quantum sensors are recalibrated on a biannual schedule with a LI-COR model 1800-02 and quartz halogen lamp that is traceable to the NIST.
Directional response is defined as the measurement error at a specific angle of incident radiation and is made of two components, azimuth error and cosine error. In other words, the directional error is an under- or over-measurement of radiation that hits the detector at an angle. A "cosine corrected" sensor is designed to maintain its accuracy when radiation comes from different angles. This is important for quantum sensors to be able to measure scattered light, particularly when making under-canopy measurements. Apogee quantum sensors achieve this through the curvature and optical qualities of the convex lens.
Azimuth Error
Azimuth error can be minimized by mounting the sensor with the cable pointing toward true north in the nothern hemisphere or true south in the southern hemisphere. Azimuth error for Apogee quantum sensors is typically less than 1 % and is easy to minimize with proper cable orientation.
Cosine Error
Our long term tests indicate that the cosine errors between completely sunny and heavily overcast days are less than 0.5 percent. Cosine errors between the summer and the winter solstice are also less than 0.5 percent. The cosine error for Apogee quantum sensors is approximately ± 2 % at solar zenith angle 45° and ± 5 % at solar zenith angle 75°.
Cosine Response Full-spectrum Quantum Sensor (500 Series)
 |
Mean cosine response of seven Apogee SQ-500 quantum sensors. Cosine response measurements were made on the rooftop of the Apogee building in Logan, UT. Cosine response was cacluated as the relative difference of SQ-500 quantum sensors from the mean of replicate reference quantum sensors (LI-COR models LI-190 and LI-190R, Kipp & Zonen model PQS 1). The red data are AM measurements; the green data are PM measurements. |
Cosine Response Original Quantum Sensor (100 - 400 Series)
 |
Mean cosine response of twenty-three original quantum sensors (error bars represent two standard deviations above and below mean). Cosine response measurements were made by direct side-by-side comparison to the mean of four reference thermopile pyranometers, with solar zenith angle-dependent factors applied to convert total shortwave radiation to PPFD. Blue points represent the AM response and red points represent the PM response. |
To accurately measure PPFD incident on a horizontal surface, quantum sensors must be level. Improper leveling of the sensor during installation or data collection is a common source of error and is difficult to detect when making measurements while holding the sensor by hand. This error is most commonly observed as a difference in AM and PM responses in data collected by a sensor mounted for continuous solar PAR measurements. Level errors are easy to minimize by ensuring the sensor is level during installation; to make leveling simple and accurate during instalation Apogee recommends using the AL-100 leveling plate with built-in bubble level. The AM-110 mounting bracket facilitates mounting the AL-100 leveling plate to a mast or a pole. When making measurements by hand, pay careful attention to keep the sensor as level as possible to reduce level error.
Changes in temperature can affect how efficiently the photodiode detector works, which results in the output of the detector varying with temperature. Increasing temperature decreases the output of most silicon photodiodes. The temperature error is insignificant for most applications.
Temperature Response Full-spectrum Quantum Sensor (500 Series)
 |
Mean temperature response of ten SQ-500 series quantum sensors (errors bars represent two standard deviations above and below mean). Temperature response measurmeents were made at 10 C intervals across a temperature range of approximately -20 to 50 C in a temperature controlled chamber under a fixed, broad spectrum, electric lamp. At each temperature set point,a spectroradiometer was used to measure light intensity from the lamp and all quantum sensors were compared to the spectroradiometer. The spectroradiometer was mounted external to the temperature control chamber and remained at room temperature during the experiment. |
Temperature Response Original Quantum Sensor (100 - 400 Series)
 |
Mean temperature response of eight original quantum sensors (errors bars represent two standard deviations above and below mean). Temperature response measurements were made at 10 C intervals across a temperature range of approximately -10 to 40 C in a temperature controlled chamber under a fixed, broad spectrum lamp. At each temperature set point, a spectroradiometer was used to measure light intensity from the lamp and all quantum sensors were compared to the spectroradiometer. The spectroradiometer was mounted external to the temperature control chamber and remained at room temperature during the experiment. |
The error associated with a sensor measurement of light from a source that has a different spectrum of light (i.e. the ratio of colors) than the source used to calibrate the sensor is called spectral error. Spectral error arises because no quantum sensor perfectly matches the defined ideal quantum response, meaning they do not respond to all wavelengths of light equally between 400 and 700 nm. Mismatch between the defined ideal quantum response and sensor spectral response results in spectral error when the sensor is used to measure radiation from sources with a different spectrum than the radiation source the sensor was calibrated with. In order to determine the spectral error, the spectral responses of the quantum sensor, calibration light source, and light source being measured are required, along with some spectra-dependent calculations.
Original Quantum Sensor Spectral Errors (100 - 400 Series)
The original quantum sensor has a spectral range of 410 to 655 nm. As the figure indicates the sensor underestimates the 400 to 500 nm wavelengths (blue light), overestimates the 550 to 650 nm wavelengths (yellow and orange light), and has little sensitivty above 650 nm (red light). Fortunately common light sources are mixtures of colors and the spectral errors offset each other.
 |
Mean spectral respone of six SQ-100 series quantum sensors (error bars represent two standard deviations above and below mean) compared to PPFD weighting function. Spectral response measurements were made at 10 nm increments across a wavelength range of 300 to 800 nm in a monochromator with an attached electric light source. Measured spectral data from each quantum sensor were normalized by the measured spectral response of the monochromator/electric light combination, which was measured with a spectroradiometer. |
Full-spectrum Quantum Sensor Spectral Errors (500 Series)
The full-spectrum quantum sensor has a spectral range of 389 to 692 nm. The sensor has an improved spectral response particullarly for red light wavelengths.
 |
Mean spectral response of six SQ-500 series quantum sensors compared to PPFD weighting function. Spectral response measurements were made at 10 nm increments across a wavelength range of 300 to 800 nm in a monochromator with an attached electric light source. Measured spectral data from each quantum sensor were normalized by the measured spectral response of the monochromator/electric light combination, which was measured with a spectroradiometer. |
Spectral Errors of Light Sources
Spectral errors are theoretical errors calculated from sensor spectral responses and spectral output of radiation sources (measured with a spectroradiometer). Only spectral errors are listed in the table. Calibration, cosine, and temperature error can also contribute to measurement error. Errors for Apogee sensors are relative to their calibration source (SQ-110 clear sun, SQ-120 Clear White Flourescent T5, SQ-500 Clear White Flourescent T5) and all other sensors are relative to a Clear White Flourescent T5.
| Light Source | Spectral Graph (click graph to enlarge) |
Spectral Error Apogee SQ-110 |
Spectral Error Apogee SQ-120 |
Spectral Error Apogee SQ-500 |
Spectral Error LI-COR LI-190R |
Spectral Error Kipp & Zonen PQS 1 |
Spectral Error Skye SKP 215 |
|||||||
| Agro Ceramic Metal Halide |  |
0.0 | -16.9 | -1.8 | -0.4 | -0.6 | -0.5 | |||||||
| Apache W LED |  |
15.8 | -1.1 | -0.5 | 0.7 | -0.1 | 0.2 | |||||||
| Blue LED 448nm |  |
4.2 | -12.7 | 0.8 | -2.0 | -3.3 | 0.6 | |||||||
| CF GE 45 W |  |
16.6 | -0.3 | -0.9 | 0.0 | 1.0 | 1.0 | |||||||
| CF Sylvania 30 W |  |
16.2 | -0.7 | -0.8 | -0.3 | 0.6 | 0.3 | |||||||
| CWF LED |  |
12.3 | -4.6 | 0.0 | 0.2 | -0.9 | 0.1 | |||||||
| CWF T5 Sylvania |  |
16.9 | 0.0 | 0.0 | 0.0 | 0.0 | 0.0 | |||||||
| CWF T8 Sylvania |  |
16.6 | -0.3 | 0.2 | 0.0 | 0.0 | -0.1 | |||||||
| CWF T12 Sylvania |  |
15.5 | -1.4 | 0.3 | -0.4 | -0.4 | -0.8 | |||||||
| Flip Ceramic Metal Halide |  |
10.9 | -6.0 | -0.3 | -0.1 | -0.6 | -0.5 | |||||||
| Green LED 524nm | 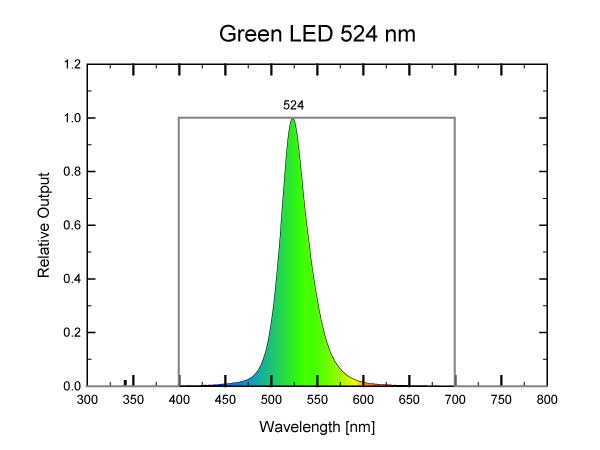 |
24.9 | 8.0 | 3.0 | 0.4 | -2.1 | -3.3 | |||||||
| High Pressure Sodium |  |
17.7 | 0.8 | 0.0 | 1.3 | 1.2 | 1.3 | |||||||
| Illumitex RB LED |  |
-36.0 | -52.9 | -2.6 | -0.5 | 1.0 | -1.0 | |||||||
| Incandescent 40 W |  |
-15.8 | -32.7 | -7.3 | -1.3 | 0.2 | 4.0 | |||||||
| Incandescent 100 W |  |
-17.0 | -33.9 | -7.6 | -1.3 | 0.3 | 4.3 | |||||||
| LI 1800-02 Calibrator |  |
-10.6 | -27.5 | -5.7 | -1.2 | -0.1 | 2.7 | |||||||
| Lighting Science RB LED |  |
-48.4 | -65.3 | -3.4 | -1.1 | 1.0 | -1.3 | |||||||
| Lighting Science RW LED |  |
-43.4 | -60.3 | -3.0 | -0.9 | -2.1 | -1.6 | |||||||
| Metal Halide |  |
13.2 | -3.7 | -5.7 | -1.3 | -1.2 | -2.3 | |||||||
| Quartz Halogen |  |
-10.5 | -27.4 | -5.7 | -1.2 | -0.1 | 2.7 | |||||||
| RB LED |  |
19.3 | 2.4 | -1.5 | 1.3 | 1.0 | 0.6 | |||||||
| Red LED 635nm |  |
21.7 | 4.8 | -2.0 | 1.8 | 1.6 | 0.5 | |||||||
| Red LED 668nm |  |
-62.2 | -79.1 | -4.1 | -1.1 | -2.2 | -1.6 | |||||||
| Reflected Conifer |  |
5.5 | -11.4 | -2.2 | -0.4 | 0.6 | 6.9 | |||||||
| Reflected Deciduous |  |
4.9 | -12.0 | -2.0 | -0.5 | 0.5 | 6.6 | |||||||
| Reflected Grass |  |
5.7 | -11.2 | -2.2 | -0.1 | 0.7 | 6.4 | |||||||
| RGB LED |  |
20.3 | 3.4 | -0.8 | 1.1 | 0.3 | -0.3 | |||||||
| Sun Clear |  |
0.0 | -16.9 | -2.2 | -1.6 | -1.1 | -0.2 | |||||||
| Sun Cloudy |  |
1.4 | -15.5 | -1.7 | -1.8 | -1.3 | -0.6 | |||||||
| Under Alfalfa Canopy |  |
6.4 | -10.5 | -1.7 | -0.1 | 0.4 | 8.0 | |||||||
| Under Maple Canopy |  |
6.8 | -10.1 | -0.9 | -1.1 | -0.4 | 4.2 | |||||||
| Under Pine Canopy |  |
5.3 | -11.6 | -0.4 | -2.1 | -1.6 | -0.7 | |||||||
| Under Wheat Canopy |  |
6.4 | -10.5 | -1.1 | -0.9 | -0.5 | 3.9 | |||||||
| Valoya RW LED |  |
-16.0 | -32.9 | -6.0 | -1.2 | -0.7 | 0.9 | |||||||
| WWF LED |  |
6.0 | -10.9 | -1.9 | 0.3 | -0.1 | 0.6 |