Apogee vs LI-COR Quantum Sensors
Click Here for a printable version of this page
INTRODUCTION
Photosynthetically active radiation (PAR) is defined as the photosynthetic photon flux density (PPFD), the sum of photons between 400 and 700 nm, with units of µmol/m2/s (micromoles of photons per meter squared per second). Quantum sensors, sometimes called PAR sensors, are used to measure the PPFD.
This research report compares two of the most widely used research grade quantum sensors in the world, the Apogee SQ-500 and the LI-COR LI-190R. These data are an excerpt from a comprehensive study that compared eight different types of quantum sensors (Blonquist and Johns. May, 2018).
SPECIFICATIONS & FEATURES
Specifications below are from the product manuals. U.S.A. list prices referenced are from the company websites.
| Apogee SQ-500 | LI-COR LI-190R | |
|---|---|---|
| Sensitivity (mV per µmol/m2/s) | 0.01 (constant) | 0.003-0.006 (with 604 Ω resistor) (Variable depending on sensor) |
| Calibration Factor (µmol/m2/s per mV) | 100 (Fixed multiplier for drop-in replacement) |
165-330 (with 604 Ω resistor) (Variable depending on sensor) |
| Calibration Uncertainty | 5 % | 5 % |
| Non-linearity | 1 % up to 4000 µmol/m2/s (2X Full sunlight) | 1 % up to 10,000 µmol/m2/s (5X Full sunlight) |
| Directional (Cosine) Response | see graphs below | see graphs below |
| Spectral Response | see graphs below | see graphs below |
| Temperature Response | -0.11 ± 0.04 % per C | ± 0.15 % per C |
| Operating Environment | -40 °C to 70 °C; 0 % to 100 % relative humidity; can be submerged in water up to depths of 30 m | -40 °C to 65 °C; 0 % to 95 % relative humidity, non-condensing |
| Housing | Anodized aluminum with epoxy-potted electronics cavity | Anodized aluminum with O-ring seal |
| Detachment for Calibration | In-line cable connector 30 cm from sensor head | Sensor top is detachable by removing three screws |
| U.S.A. Manufacturer List Price | Similar, but the LI-COR LI-190R is ~25 % more than the Apogee SQ-500. LI-COR with a fixed multiplier option is ~50 % higher cost. | |
DIRECTIONAL (COSINE) RESPONSE
(Both sensors have less than 2 % error up to zenith angles of 60°.)
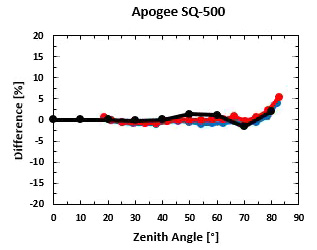
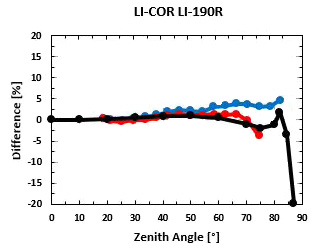
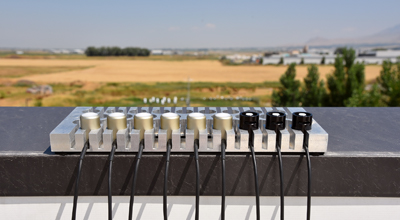
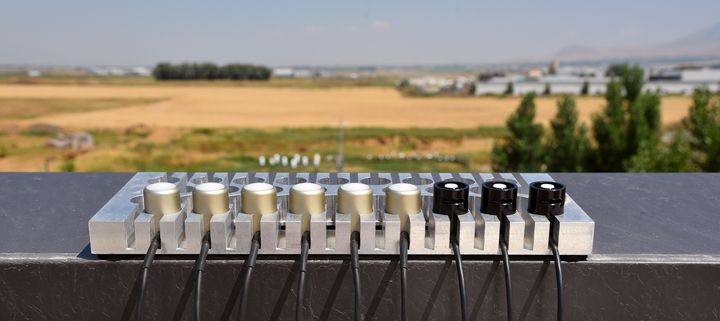
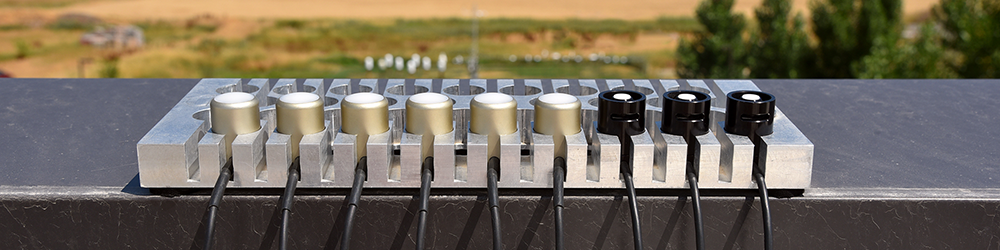
The cosine response of six replicate Apogee and three replicate LI-COR quantum sensors (see photo at top) were determined under sunlight (dawn to dusk) by comparison to the PPFD calculated from shortwave irradiance measurements (blue lines are mean AM responses and red lines are mean PM responses).
These measurements closely matched the directional response measured in the laboratory for the Apogee (black line) and the directional response from the product manual for the LI-COR (black line). Directional errors were less than 2 % up to zenith angles of about 60° and less than 5 % up to zenith angles of about 75°. Quantum sensors from other manufacturers had larger directional errors (Blonquist and Johns. May, 2018).
SPECTRAL RESPONSE
(Spectral errors for both sensors were less than 4 % for all lights tested.)
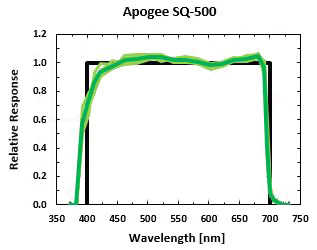
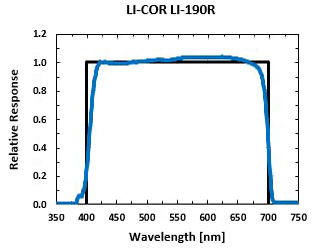
Spectral responses compared to defined PAR (black line). The response of the Apogee was measured in a monochromator (dark green line is the mean of six replicates, light green lines are data for each replicate). The response of the LI-COR is from the product manual. Spectral responses of quantum sensors from other manufacturers did not match defined PAR as well as these two sensors (Blonquist and Johns. May, 2018).
SPECTRAL ERROR
Spectral errors for sunlight and common electric lights were calculated from the spectral responses. Spectral errors for both sensors were less than 4 % for all lights tested. Quantum sensors from other manufacturers did not achieve these small spectral errors (Blonquist and Johns. May, 2018).
| Radiation Source | Apogee SQ-500 | LI-COR LI-190R |
|---|---|---|
| Clear Sky | 0.0 (0.0*) | 0.0 (0.0*) |
| Overcast Sky | 0.1 | 0.1 |
| Reflected from Plant Canopy | -0.3 | 1.1 |
| Transmitted below Plant Canopy | 0.1 (4.9*) | 0.7 (1.1*) |
| Cool White Fluorescent T5 | 0.1 | 1.8 |
| Metal Halide | 0.9 (-0.4*) | 0.4 (0.8*) |
| Ceramic Metal Halide | 0.3 | 1.3 |
| Mogul Base High Pressure Sodium | 0.1 (2.2*) | 3.2 (3.3*) |
| Dual-ended High Pressure Sodium | -0.1 | 2.8 |
| Blue LED 448 nm Peak | -0.7 | -0.2 |
| Green LED 524 nm Peak | 3.2 | 2.2 |
| Red LED 635 nm Peak | 0.8 | 3.6 |
| Red LED 667 nm Peak | 2.8 (5.2*) | 0.9 (2.4*) |
| Cool White LED | 0.5 | 2.0 |
| Neutral White LED | 0.5 | 2.0 |
| Warm White LED | 0.2 | 2.1 |
*Numbers in parentheses refer to spectral errors published in a technical note (LI-COR Biosciences, 2018).The LI-COR data for the Apogee SQ-500 are from an earlier version of the SQ-500. The Apogee data for the SQ-500 were from the latest version, which was released in October 2017. The latest version includes a more exact 700 nm cutoff. To allow relative comparison, the numbers from the LI-COR technical note were scaled so errors were zero under sunlight.
Blonquist Jr., J.M., and J.A. Johns. 2018. Accurate PAR measurement: Comparison of eight quantum sensor models. Apogee Instruments Research Report, published online May 2018 (https://www.apogeeinstruments.com/content/Comparison-of-Eight-Quantum-Sensor-Models.pdf)
LI-COR Biosciences. 2018. Comparison of quantum sensors with different spectral sensitivities. LI-COR Biosciences Technical Note, published online February 2018 (https://www.licor.com/documents/oi26ib7eb6wm5y5u9ebv4b3jodm09tf9).