Comparison of Three Fan-Aspirated Solar Radiation Shields
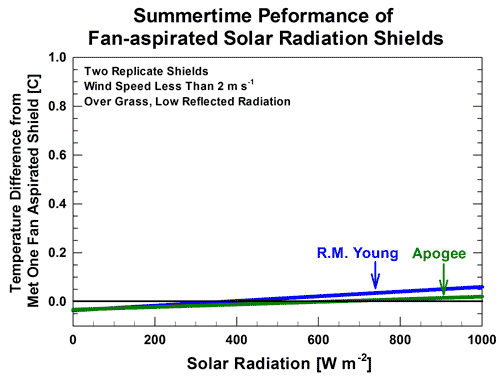
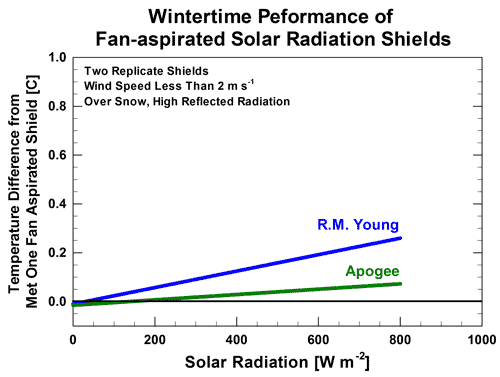
The Apogee model TS-100 compares favorably to two higher-power fan-aspirated shields considered to be industry leaders (R. M. Young model 41003-5 and Met One model 076B). Field data comparing the performance of these three models of shields over a two year period were collected at Apogee Instruments in Logan, Utah. These data show that the Apogee model TS-100 provides accurate air temperature measurement in all conditions (Figures 1 and 2).

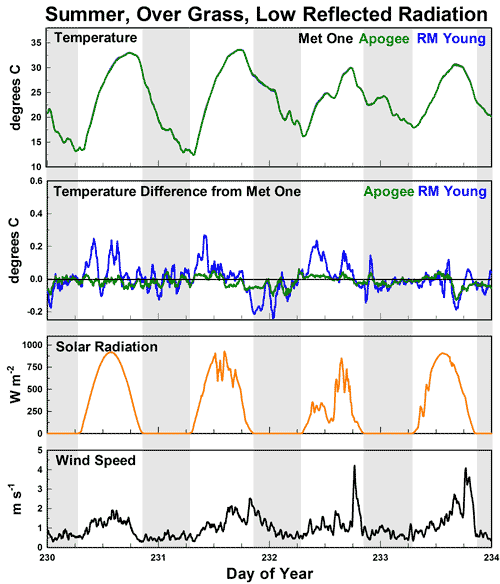
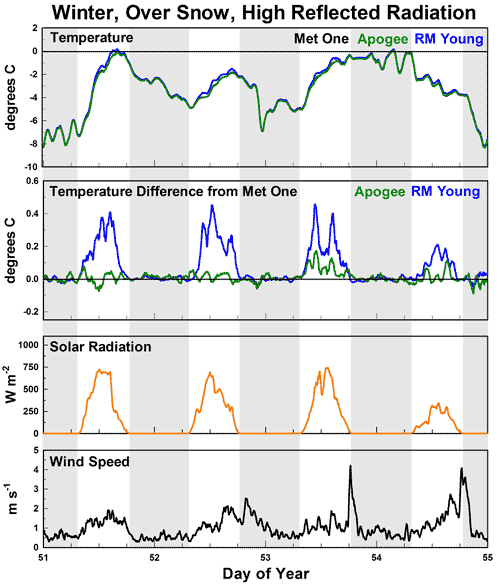
The data indicate that the errors from the apogee shield were slightly smaller than the R.M. Young shield during summer over green turf grass with low reflected solar radiation (Figure 1, left). In these conditions, errors were less than 0.06 C. During winter over snow (high reflected solar radiation), the data (based on best fit regression lines of over 5000 data points), indicate the Apogee model TS-100 more closely matches the Met One model 076B shield than the R. M. Young model 41003-5 shield (Figure 1, right). Using a representative subsample of data, observed temperature differences for the Apogee and R. M. Young shields over time indicate that the TS-100 shields are less susceptible to reflected solar radiation (Figure 2).
Figure 1: Effect of solar radiation on the temperature increase of the Apogee and the R.M. Young fan aspirated radiation shields compared to a Met One model 076B reference shield. Left: Summer. Right: Winter. Plots show the temperature increase based on best fit regression of over 5000 data points collected over multiple months in each season. Temperatures in all fan-aspirated shields were measured with small, calibrated, precision thermistors of the same model.
Figure 2: Time series graphs over four days. Left: Summer. Right: Winter. Top panel to bottom panel: Air temperature measurements from three fan aspirated shields: Apogee model TS-100 (green plot), R. M. Young model 41003-5 (blue plot), and Met One model 076B (black plot); temperature differences of a TS-100 (green plot) and a 41003-5 (blue plot), where differences were calculated by subtracting air temperature measured in a reference Met One model 076B shield from air temperature measured in the TS-100 and 41003-5; incoming shortwave radiation (measured with a pyranometer); and wind speed (measured with a cup anemometer). Temperatures in all fan-aspirated shields were measured with small, calibrated precision thermistors of the same model.


