Light Intensity Measurements for Light Emitting Diodes (LEDs)
Customers often contact Apogee Instruments to inquire about whether quantum sensors and meters can be used to measure the radiation intensity from light emitting diodes (LEDs), as LEDs are becoming increasingly common as light sources for plant growth in controlled environments and coral growth in aquariums. Another article provided some qualitative information regarding the use of a broadband device (i.e. quantum/PAR sensors or meters) to measure a narrowband radiation source (i.e. many LEDs currently on the market), where it was stated that a spectroradiometer is the best instrument to accurately measure light intensity of LEDs (see the October 5, 2011 post titled ‘Comparisons in Quantum Sensor Output for Different Light Sources’). While this is true, quantum meters can be used to measure LED intensity, and many customers use them for this application. As a result, an estimate of Apogee quantum meter accuracy for measuring LEDs is very practical.
A quantum sensor/meter is designed to measure the total number of photons between 400 and 700 nm, the photosynthetically active radiation (PAR) range. The error associated with a quantum meter (or sensor) measurement of light from a source that has a different spectrum than the source used to calibrate the meter is called spectral error. Spectral error arises because no quantum meters perfectly match the defined quantum response, meaning they do not respond to all wavelengths of light equally between 400 nm and 700 nm. Apogee quantum meters are sensitive to wavelengths between approximately 370 nm and 665 nm, with a relatively flat response between 450 nm and 650 nm due to the blue pigment used in the diffuser (Figure 1). However, they are not equally sensitive to the wavelengths within the photosynthetically active range (Figure 1). In order to determine spectral error, the spectral responses of the quantum meter, calibration light source, and light source to be measured are required, along with some spectra-dependent calculations (for details, see Federer and Tanner, 1966; Ross and Sulev, 2000).
Apogee quantum sensors and meters for electric lighting are calibrated in a custom chamber filled with T5 cool white fluorescent lamps. LEDs have a very different spectral output than T5 lamps (Figures 2, 3, and 4), thus, some degree of spectral error is expected. For the narrowband, broadband, and mixed LEDs shown below, spectral errors are 8 % or less. Apogee quantum sensors and meters are less sensitive to blue wavelengths (near 400 nm) compared to longer wavelengths and read low under blue LEDs. Conversely, Apogee quantum sensors and meters are more sensitive to green and red wavelengths (above 500 nm) compared to blue wavelengths and read high under green and red LEDs. The broadband white LEDs output a small proportion of radiation beyond the upper end of the Apogee quantum sensor/meter sensitivity range (665 nm) and yield low measurements for the white LEDs.
IMPORTANT NOTE: LEDs that output a large proportion of radiation above approximately 660 nm will read very low and should not be measured with Apogee Original Quantum Sensors (models SQ-100, 200, 300, and 400) but will work great with Apogee Full-spectrum Quantum Sensors (model SQ-500).
Apogee Instruments recently presented a comparison of spectral errors under LEDs for multiple quantum sensors at the 2012 International Meeting on Controlled Environment Agriculture. See the PDF of the poster here.
Table 1: Theoretical Spectral Errors for Apogee Quantum Meter Measurements of Multiple LED Sources
| LED | Electric Calibration Error [%] |
| Blue (448 nm peak, 10 nm FWHM) | -10.7 |
| Green (524 nm peak, 15 nm FWHM) | 5.8 |
| Red (635 nm peak, 10 nm FWHM) | 4.7 |
| Cool White | -4.2 |
| Neutral White | -6.1 |
| Warm White | -9.9 |
| Red, Blue Mixture | 2.7 |
| Red, Green, Blue Mixture | 3.5 |
For more light source spectral errors and information on how to correct for those errors, visit Spectral Errors for Popular Light Sources and How to Correct Them.
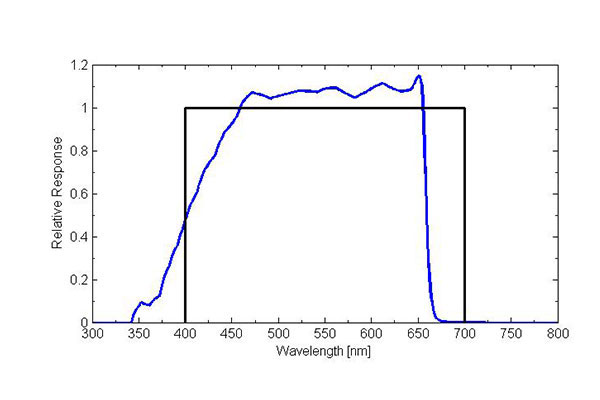
Figure 1: Apogee quantum sensor/meter response (blue line) compared to defined quantum response (black line) of equal sensitivity at all wavelengths between 400 nm and 700 nm.
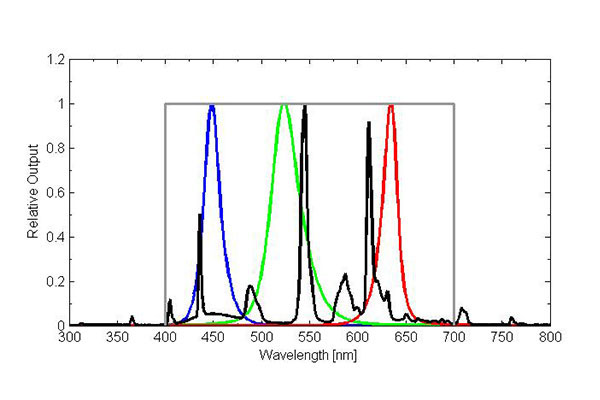
Figure 2: T5 cool white fluorescent spectrum (lamp used by Apogee for electric light calibration of quantum meters; black line) compared to narrowband color LEDs (blue, green, red lines) and defined quantum response (gray line).
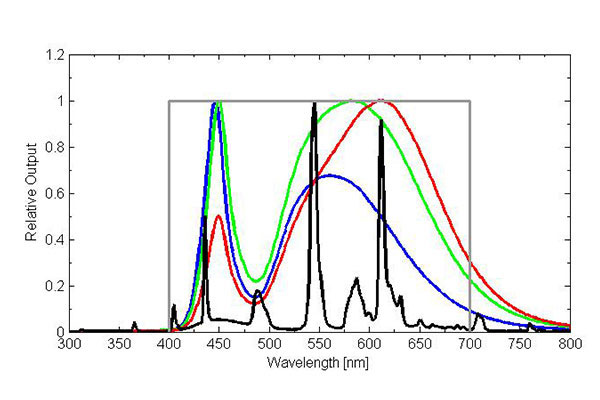
Figure 3: T5 cool white fluorescent spectrum (lamp used by Apogee for electric light calibration of quantum meters; black line) compared to broadband white LEDs (cool white fluorescent – blue line, neutral white fluorescent – green line, warm white fluorescent – red line) and defined quantum response (gray line).
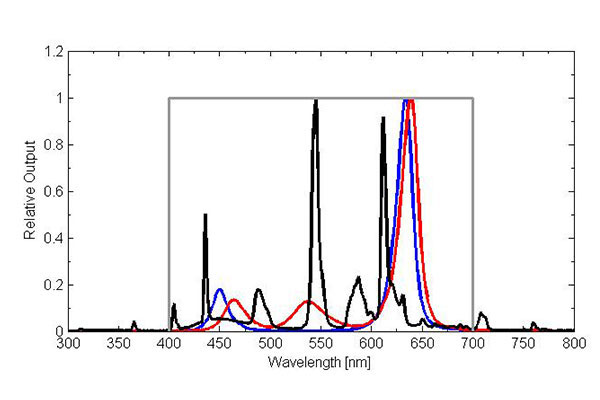
Figure 4: T5 cool white fluorescent spectrum (lamp used by Apogee for electric light calibration of quantum meters; black line) compared to mixtures of narrowband color LEDs (red/blue – blue line, red/green/blue – red line) and defined quantum response (gray line).
References
Federer, C.A. and C.B. Tanner, 1966. Sensors for measuring light available for photosynthesis. Ecology 47:654-657.
Ross, J. and M. Sulev, 2000. Sources of errors in measurements of PAR. Agricultural and Forest Meteorology 100:103-125.