Determining Grow Light Position Using a PAR Meter
Determining the best position for your grow light isn’t always a simple task. Each light distributes light differently on the grow area making it difficult to know where to position the light for maximum yield. To help growers determine the right position, lighting manufactures will provide a recommended hanging height for the light, the area the light will cover at the recommended height, and a photosynthetically active radiation (PAR) value for the light. Although this information can be a great starting point, it doesn’t tell growers the amount, or distribution of usable light throughout the grow space. To give growers a better understanding of usable light in a grow space, MIGRO, a developer of advanced grow lights, purchased an Apogee Instruments Full-Spectrum Quantum Sensor.
MIGRO uses the quantum sensor to create PAR intensity maps of grow spaces in numerous light and grow space experiments found on the MIGRO YouTube Channel. The PAR maps created in the experiments show the amount of PAR available in each experiment setup.
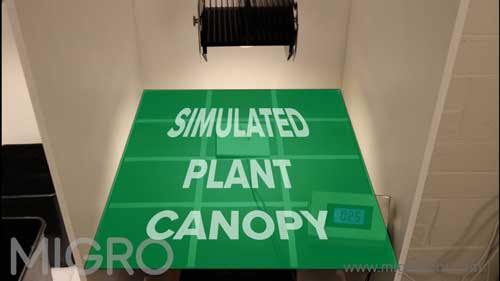
To begin creating the PAR map, a base in the grow space is divided into a grid that will simulate the plant canopy.
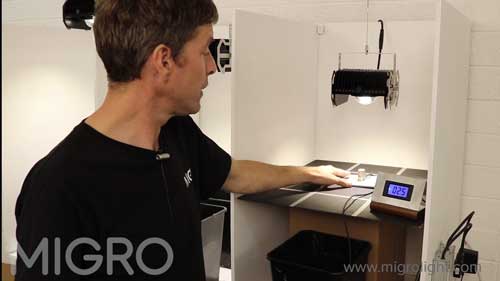
Using the quantum sensor, PAR is measured at the center of each grid section and is recorded.
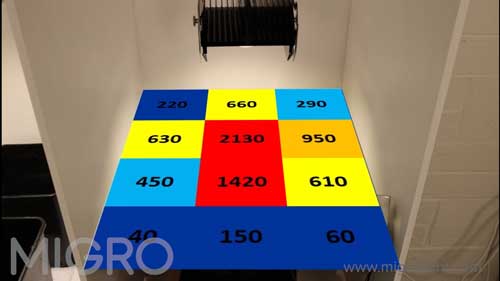
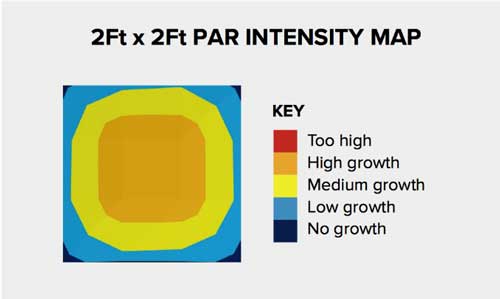
Once the PAR value of each grid section has been measured the values are inserted into the respective grid space to create a PAR map.
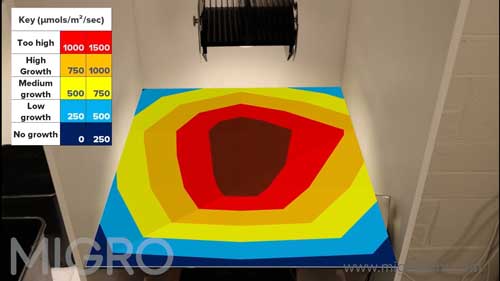
The PAR map shows how much PAR the plant canopy will receive when the top of the plant canopy is positioned at the same height as the simulated canopy.
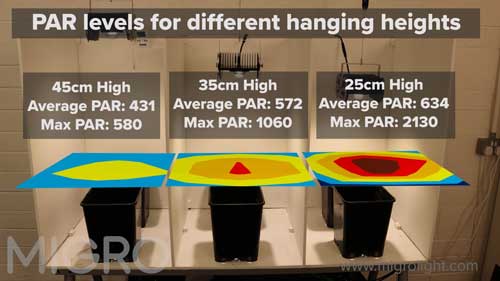
In a recent experiment, MIGRO demonstrated how the hanging height of a grow light affects PAR and growth. In the experiment, grow lights were setup at different heights in three grow spaces. Below is a video of the experiment setup.
Each of the three space held a tomato plant and bedding plant that were filmed by a time lapse camera (video below) during the three week growth period.
Before beginning the experiment PAR maps were made for each setup, to show the expected growth for each space.
At the end of the experiment the yield and growth of the plants were assessed in comparison to the expected growth shown by the PAR maps. Throughout, the grow period the plants grew as expected for the available PAR levels. To view the full experiment, the steps used to create the PAR maps for each grow space, and the final outcome watch the video below.